


Related Resources


Executive Summary
Transparency reports of the largest social media platforms continue to be anything but transparent. New research from the ADL Center for Tech & Society (CTS) shows that most of these platforms only publish partial information about how much hate content they remove or action in some way.
To make matters worse, these reports are often hard to locate, void of meaningful information, and only provide patchy insights into how platforms address hate, harassment, and antisemitism. Furthermore, there is no way to independently verify transparency reports, meaning that users, researchers, and civil society must take companies at their word.
Yet these reports are key to allowing civil society and governments to determine whether there are gaps between platforms’ guidelines for curbing hate, and how those guidelines are enforced. And understanding effective and ineffective policy and enforcement tactics, as well as general trends and issues, can also inform lawmakers’ ability to push for effective regulation.
We recommend that platforms:
Publish consistent, standardized transparency reports on a regular basis
Simplify their transparency centers
Provide data access to independent researchers, and submit to third party evaluations
Improve public access to clear and comprehensible transparency reports
What’s in this report
CTS has evaluated the state of transparency reporting at nine of the world’s largest social media companies. We outline what transparency reporting should look like in an ideal world, describe our approach to evaluation, and briefly summarize each company’s performance. We conclude with recommendations for better transparency reporting and what we will be looking for as companies comply with new regulations.
Background
Most social media companies govern user behavior through a set of community rules or guidelines covering hate speech, harassment, and other harmful content. This applies even to fringe sites with little or no content moderation. The public currently relies on tech companies’ self-reporting to assess such efforts. Consistent, thorough, and easy-to-understand reporting on the amount of content that violates these policies, and what steps companies take to enforce their rules, is necessary to hold platforms accountable.
Transparency reports act as supporting evidence for platforms’ claims that their content moderation systems are adequate and effective. When done well, these reports demonstrate platforms’ commitment to user safety and security; they can serve as assurances that policies are being enforced consistently and fairly, in addition to documenting due process for user appeals. ADL has previously documented limitations to transparency reporting and centers, and offered a roadmap for what platforms—and governments—should do to fix them.
Until recently social media companies had little legal incentive to publish transparency reports. Germany’s Network Enforcement Law requires social media platforms with more than two million users in the country to publish reports about their content moderation efforts, as of October 2017. The European Union’s Digital Services Act and California’s AB 587,1 both of which have new reporting requirements, are more important regulations that will require companies to report regularly on how very large online platforms are enforcing their terms of service. As these laws take effect, CTS set out to establish a baseline understanding of what many existing transparency reports do well and how they could improve adherence.
What makes good transparency reporting?
Transparency reports are crucial resources that help contextualize CTS’s work fighting hate, harassment, and antisemitism online (see our Online Hate and Harassment report). They also have an impact of policy changes on platform activity. While platforms report on a wide range of enforcement actions, from combating fraud and spam to responding to requests from law enforcement agencies and governments around the world, this audit focuses on “rules enforcement” or “community guidelines enforcement” reports, where platforms report on their efforts to identify and take action against violative content.
We determined four key metrics and data necessary to make transparency reports consistent and effective, including what information should be included in each reporting period:
Violative view rate (VVR):
This metric measures the percentage of content users viewed that violated one or more of the platform’s policies. YouTube was the first to develop and report on this metric, but it can be applied to all social media platforms.
VVR provides insight into how widely violative content spreads on a given platform by estimating such content’s relative harm.
Content on which the platform took action, including:
Total actions, as raw numbers and as a share of all content on the platform
Types of content that were actioned (e.g., text, images, videos, etc.) as a share of all actions and as a share of all types of violations.
The share of actioned content that was flagged manually by user reports versus proactively (e.g., automated/AI-assisted flagging or the platform’s moderation team flagging content), and how those figures correlate with types of violations (e.g., hate vs. spam).
The average turnaround time for each type of action (e.g., how long it took between a user report or an AI moderator flag and the content being actioned).
Breakdowns for all the above of different geographic regions and the top 10 languages in which each platform is accessed.
Types of action as a share of total actions (e.g., “50% removals, 30% account suspensions, 20% applying labels to content”). These figures should be broken out further to include:
How types of action correlate with the specific policies that problematic content violates (e.g., “75% of all content removals were for hateful conduct violations”)
Targeted characteristics for hateful and harassing content (e.g., share of all content that was antisemitic, anti-Black, anti-LGBTQ+, etc.)
The share of total actions that were appealed, and the share of those appeals that were reversed. This metric should be broken out further to include:
- The share of both appeals and reversals that were in response to proactive moderation versus user reports.
In addition to these four types of data or metrics, effective reports must also be:
Easily accessible. It should be easy to find a link to the platform’s transparency center from the platform’s main landing page or feed (that is, the first place users land when they log into or access the site).
Published at regular intervals, ideally quarterly. Most of the platforms we evaluated publish either quarterly or biannually. Depending on the types of service that it provides and its size, it might be more appropriate for a platform to publish only two reports per year instead of four. Regardless, more frequent reporting is important for gauging the impact of world events or policy changes on platforms’ enforcement activity.
Consistent and comparable with previous reports. While reports should be flexible enough to respond to evolving policies, data, and other considerations, consistency is key. Reports should include the same metrics and categories from report to report as much as possible, even if there is additional information or context, so key statistics can be directly compared over time. Platforms should also maintain an easy-to-find archive of past reports and data.
Independently verifiable. There are legitimate reasons to restrict access to certain information about a platform’s business, such as trade secrets, data connected to users’ Personally Identifiable Information (PII), or details about content moderation that bad-faith actors could weaponize. Yet platforms should make data about enforcement available to independent third-party audits to the fullest extent possible. Granting access to trusted and vetted research partners via an open application programming interface (API) helps facilitate verification.
Evaluating Platforms
CTS evaluated transparency reporting from Meta (which includes Facebook and Instagram), YouTube, TikTok, LinkedIn, Snapchat, Reddit, Pinterest, X (formerly Twitter), and Twitch. These nine companies and their social platforms each have more than 100 million monthly active users worldwide, and are among the world’s top 25 largest platforms.
The prevalence of harmful content varies greatly by platform, depending on its degree and mode of social interaction. CTS has consistently found more harassment on Facebook, Instagram, X, TikTok, and YouTube in our annual surveys, for example. Yet transparency reporting is a strong signal that a company values user safety and security, and that it has a process in place for addressing hate, harassment, and antisemitism.
CTS evaluated each company’s reporting according to five criteria:
Comprehensive:
Did the company’s transparency efforts contain all relevant information about hate, harassment, and antisemitism?
Consistent:
Did the company’s transparency efforts repeat the same categories over time to allow for year-on-year comparison?
Regular:
Did the company repeat its transparency efforts with similar frequency over time?
Ease:
How easy is it to find a company’s transparency reporting, past and present?2
Verifiable:
Can third-party researchers verify any of the claims made by the company, i.e., through access to platform data?
Results (Ranked by Userbase)
META (Facebook & Instagram)
What’s included?
Prevalence, a metric comparable to VVR; manual vs. automated and user-reported vs. proactive flagging for specific types of violation; appeals vs. reversals for specific types of violation
What’s missing?
Actions as a share of all content; types of action as a share of all actions and for specific types of violation; types of content actioned; most frequently targeted groups; turnaround time; geographic and language distribution
Consistent:
Graphs and charts include data from past reports; downloadable spreadsheets include data from past reports; no easily accessible archive
Regular:
Publishes quarterly reports since at least 2017 Q4.3 Most recently reviewed report is for July – September 2023
Ease:
Accessible within four clicks each for Facebook’s and Instagram’s web versions; within seven clicks and 11 clicks, respectively, for mobile versions
Verifiable:
Partially (limited or restricted access for third parties to platform data for research and evaluation)
Meta’s latest reports cover the most recent period (2023 Q3) of any company we evaluated. The transparency center and reports, however, are relatively difficult to find. The number of clicks from the login page to report is the most of any of the companies we evaluated, and, more importantly, the pathway is not very intuitive: the word “transparency” does not appear until the user has navigated through at least two additional web pages. The discovery process is even more difficult on mobile.
Facebook’s and Instagram’s reports are available in the same place, and visitors can toggle between them by selecting from a drop-down menu:
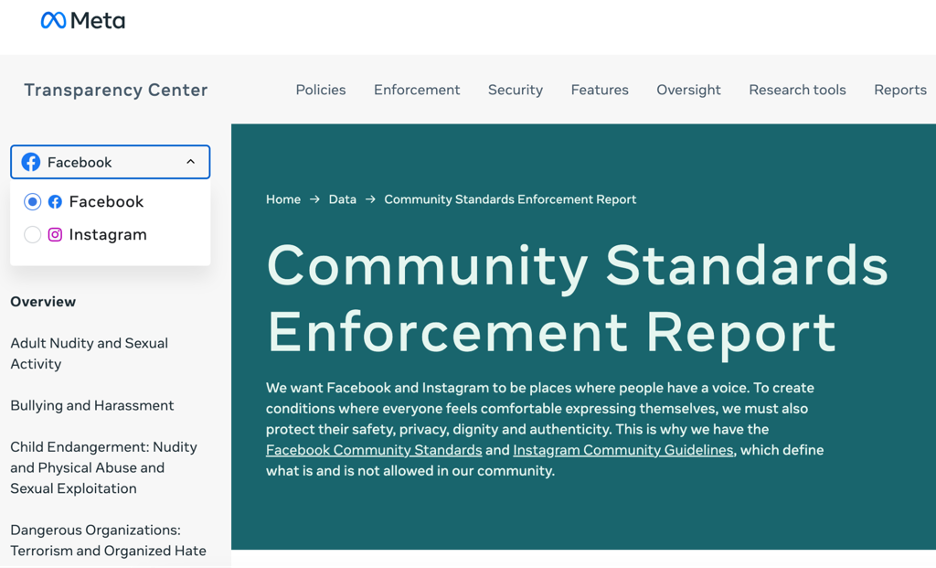
Screenshot, September 22, 2023.
Both reports highlight recent trends on Facebook and Instagram on the landing page before linking to breakout pages with details about specific policy areas. Some of the highlighted trends—such as the proactive rate of enforcement on hate speech on Facebook or on organized hate on Instagram—are reported as percentages. But the majority are given only as raw numbers. These “numerators without denominators” appear dramatic, e.g., 750,000 pieces of organized hate content were actioned on Facebook in 2023 Q3. Without contextual information there is no way of knowing whether this is a large number, or just a small fraction of such content. Moreover, by making visitors navigate to separate pages for each policy area Meta adds obstacles to the discovery process.
Finally, Meta makes spreadsheets for both Facebook and Instagram data available for download. These files include comparisons with past transparency reporting periods for each policy area. They do not provide any additional value beyond archiving past data. Past reports exist and can be found via search, but there is no easily accessible archive page or menu for directing visitors to them. Meta does provide access for vetted researchers to its public data via CrowdTangle4 and its Meta Content Library and API since August 2023. These data are not comprehensive, however, and do not allow insight into enforcement actions.
*The Meta Content Library and API were in beta prior to August 2023; ADL has not yet been granted access and was therefore unable to evaluate them beyond the public documentation.
YOUTUBE
What’s included?
VVR; types of content actioned and for specific types of violation; manual vs. automated flagging for specific types of violation; appeals vs. reversals; geographic distribution for removals
What’s missing?
Actions as a share of all content; types of action as a share of all actions; appeals vs. reversals for specific types of violation; most frequently targeted groups; turnaround time; language distribution
Consistent:
Graphs and charts include data from past reports; drop-down menus let visitors toggle between data from past reports; downloadable spreadsheets include data from past reports; no easily accessible archive
Regular:
Publishes quarterly reports since at least 2017 Q4. Most recently examined report is for April - June 2023
Ease:
Accessible within three clicks for the web version, and five clicks for the mobile version
Verifiable: Partially
YouTube provides comprehensive reports and an open API for researchers, although the transparency reports are challenging to locate. Although they are fewer clicks away than some of the other companies we evaluated, users must navigate through a cumbersome discovery process. The word “transparency” does not appear on any links, even though the report itself is titled “Google Transparency Report.”
The reports are generally comprehensive and legible, but many of the data are provided without meaningful contextual information to help visitors interpret their significance. For example, independent researchers could, in theory, calculate the share of total actions that a specific type of content—like comments—represents. But this information should be provided by YouTube.
Additionally, there is no information about non-removal types of enforcement, such as adding information panels to videos, which YouTube does to identify election and health-related misinformation.
YouTube is one of the only large social media platforms that still has an open data API for researchers, which means that some of the data in these reports could be independently verified by third-party auditors. Unless an auditor is collecting video data in real-time, however, they would not be able to detect any content that YouTube proactively detected and actioned. And data on proactive versus human flagging are completely inaccessible.
TIKTOK
What’s included?
Actions as a share of all content and for specific types of violation; manual vs. automated flagging; appeals vs. reversals; turnaround time; geographic distribution; language distribution for moderation teams
What’s missing?
VVR; types of content actioned; types of actions besides removal; appeals vs. reversals for specific types of violation; most frequently targeted groups
Consistent:
Past reports are easily accessible via a sidebar menu; graphs and charts include data from past reports; drop-down menus let visitors toggle between data from past reports; downloadable spreadsheets include data from past reports
Regular:
Publishes quarterly reports since 2021 Q1. Before then, published biannual reports since at least H2 2019. Most recent report is for July - September 2023
Ease:
Accessible within two clicks on the web version, and eight clicks on the mobile version
Verifiable: Partially
TikTok is a relative newcomer, having launched in 2016 and rapidly gained over a billion monthly active users globally. For this reason, the company does not have a long history of transparency reporting. Despite this, its reports have been regular and consistent, and beginning with the 2021 Q3 report the quality of data reported has improved significantly. Compared to the other platforms we analyzed, TikTok’s reports are relatively easy to find, especially for the platform’s web version. While the first link on TikTok’s landing page is not prominent, it is titled “Transparency,” the only platform we evaluated for which this is the case. The mobile version, however, is more difficult to navigate, which is unfortunate because TikTok’s mobile app is the primary way most users access the site.5
Unlike some of its competitors, TikTok reports on its moderation teams’ response time to user-reported content as a share of total reports. It also provides data about ad removals, inauthentic engagement, a breakdown of its moderation teams by primary language, and specific insights about covert influence operations that it detected, including how many accounts and followers were part of the networks. None of the other companies we evaluated included these sorts of data or featured them as prominently as TikTok did.
TikTok does have a research API and has indicated plans to release an API specifically for civil society organizations. But as with YouTube, API access only affords narrow opportunities for verification.
What’s included?
Total actions and for specific types of violation; manual vs. automated flagging
What’s missing?
VVR; total actions as a share of all content; types of content actioned; types of actions besides removal (if applicable); appeals vs. reversals; turnaround time; most frequently targeted groups; geographic and language distributions
Consistent:
Menu tabs let visitors toggle between data from past reports; no easily accessible archive
Regular:
Publishes biannual reports since at least H1 2019. Most recent examined report is for January – June 2023
Ease:
Accessible within three clicks for the web version, and five clicks for the mobile version
Verifiable: Limited to zero
LinkedIn differs from the other platforms we evaluated in being a site for professional networking, not a general social media service. Though it shares some features of a typical social media platform, such as a news feed, personal profiles, following other users (mutually or not), and direct messages, it has proved less vulnerable to hate and harassment—likely because of its intended use and focus. Its biggest concerns are around privacy and inauthentic accounts and job listings. LinkedIn is not immune to hate and harassment, however, as it details in its biannual “Community Reports.” LinkedIn’s reports are not easy to find, but there is a link labeled “Transparency Center” visible once visitors navigate to the Help Center page.
LinkedIn does offer a developer API that can be used to retrieve content from pages, but it is unclear whether this tool affords access to data about content violations. Without that or similar access, it is impossible to verify any of LinkedIn’s claims.
SNAPCHAT
What’s included?
VVR; total actions as a share of all content and for specific types of violation; turnaround time; geographic distribution; appeals vs. reversals
What’s missing?
Manual vs. automated flagging; types of content actioned; types of action; most frequently targeted groups; language distributions
Consistent:
Sidebar menu lets visitors navigate to past reports; easily accessible archive; downloadable spreadsheets available for country- and region-specific data, but does not include historical data
Regular:
Publishes biannual reports since at least H2 2015. Most recent report is for January – June 2023
Ease:
Accessible within four clicks for the web version, and six clicks for the mobile version
Verifiable: No
From 2015 to 2020, Snapchat only reported on government requests and legal notifications in its biannual transparency report. Beginning in 2020 H1, the platform began including data about content and account violations and how these were actioned. The discovery process is not very intuitive, but there is a link labeled “transparency report” in the Safety Center. It takes longer to navigate on the mobile app than the web version—which is true of every platform we evaluated. But like TikTok, Snapchat’s user base primarily accesses the site through the mobile app, so improving discovery on mobile should be a priority.
Snapchat has a development kit with different APIs, but none support research. Besides the downloadable country-level spreadsheets, Snapchat does not appear to make any of its content moderation data available to independent researchers. These resources are necessary for the claims in the transparency report to be verifiable.
X / Twitter
Note: Our assessment is for the reports up until the last transparency report in 2021, although it remains unclear if the company will continue with this practice. X/Twitter shared limited data from the first half of 2022 in a blog post in April 2023, including total numbers of removals, actions, and suspensions by type of policy violation, but no VVR or further breakdowns. They have released no information on the future of transparency reporting at the company since. Because of this we were unable to rate them.
What’s included?
VVR; total actions and for specific types of violation
What’s missing?
Total actions as a share of total content; types of action; types of content actioned; manual vs. automated flagging; turnaround time; appeals vs. reversals; most frequently targeted groups; geographic and language distributions
Regular:
Published biannual reports since 2012 H1, but future cadence, if any, is unknown. Most recent report is for July - December 2021. Archived reports are available as far back as H2 2018, but links to earlier reports are broken.
Consistent:
Graphs and charts include data from past reports; drop-down menu lets visitors toggle among data from past reports; no easily accessible archive
Ease:
Accessible within five clicks for the web version, and seven clicks for the mobile version
Verifiable: Limited to zero
X/Twitter has not released any reports since 2021 H2. Following the platform’s change in ownership in October 2022, X made several changes to its policies and enforcement, which may account for the lack of reports for all activity in 2022 and 2023. The company has also made several announcements about transparency, including the release of the “Twitter Files” and a partial disclosure of the platform’s source code. But these are not the same as transparency reporting on policy enforcement, nor do they provide the metrics or context that make transparency reports worthwhile. An attempt by X to challenge the constitutionality of California’s AB 587 law was recently rejected by a California’s U.S. District court, which found that the reporting requirements were not “unjustified or unduly burdensome within the context of First Amendment law.”
Reports are accessible through the recently rebranded X Transparency Center, but the discovery process is not as intuitive as it could be; the word “transparency” does not appear until scrolling to the bottom of the Help Center page.
In 2023, X/Twitter introduced new costs and restrictions on access to its research API, which limits third-party and independent researchers’ ability to verify its enforcement claims.
What’s included?
VVR (called Reach); total actions and for specific types of violation; types of content actioned; manual vs. automated flagging as a share of total actions; appeals vs. reversals
What’s missing?
Total actions as a share of total content; turnaround time; most frequently targeted groups; geographic and language distributions
Consistent:
Graphs and charts include data from past reports; easily accessible archive
Regular:
Publishes biannual reports since 2021 H1, and one annual report before that. Prior to 2020 Pinterest only reported on law enforcement and government requests, every quarter since 2013 Q3. Most recent report is for January through July 2023.
Ease:
Accessible within four clicks for the web version, and six clicks for the mobile version
Verifiable: Limited to zero
Pinterest differs from the other platforms we evaluated in terms of how it is used for social interaction. Users can share images and create virtual pinboards of curated content. And while commenting is possible, most pins receive relatively few, especially compared to a platform like Facebook or YouTube. Its combination of features and typical use mean that hate and harassment manifest on Pinterest in different ways, such as hateful products or users. These put different demands on requirements for content moderation. For this reason, Pinterest’s transparency reports focus on actions against individual pieces of content, collections of content, and individual accounts that share problematic collections.
Even though Pinterest publishes reports biannually, data are divided into quarters, which is somewhat confusing. The discovery process for Pinterest’s reports is not completely intuitive, though it is easier than that of many other companies we evaluated, and the word “Transparency” appears after visitors have navigated to the “Privacy Policy” section of the website. Pinterest also does not have a dedicated research API, and third parties cannot verify the claims made in its reports.
Pinterest is unique among the companies we evaluated in reporting data about climate misinformation and conspiracy theories. Including those data may be a reflection of the company’s values regarding content moderation, such as a prior hardline stance against vaccine misinformation.
What’s included?
Total actions as a share of all content, by type of action, for specific types of violation, and by types of content; manual vs. automated flagging correlated with specific types of violation; appeals vs. reversals correlated with specific types of violation
What’s missing?
VVR; turnaround time; most frequently targeted groups; geographic and language distributions
Consistent:
Easily-accessible archive; structure of reports changed after 2020, making historical comparisons more difficult
Regular:
Publishes biannual reports since 2022 H1, annually since at least 2014. Most recent report is for January – June 2023
Ease:
Accessible within four clicks for the web version, and six clicks for the mobile version
Verifiable: Partially
Reddit’s earliest transparency reports covered only information about external government and law enforcement requests. Starting with the 2019 report, it began sharing more details about content moderation. 2022 was the first year that Reddit published reports biannually, which will be the regular cadence going forward. The discovery process for the reports is not very intuitive, but there is a tab labeled “Transparency” once visitors have navigated to Reddit’s Content Policy page.
Reddit distinguishes itself from the other companies we evaluated by publishing data about the share of total user reports that were actionable. Not every user-submitted report is genuine; reporting can be weaponized by bad-faith actors to disrupt content moderation efforts and coordinate targeted harassment, a phenomenon that Reddit and others call “brigading.” All platforms are vulnerable to brigading, but by publishing data on actionable reports Reddit is transparent about the significance of the problem and their role in managing it.
While most of Reddit’s charts succeed in presenting both raw numbers and the share of the total that they represent, some charts are missing vital information. For example, this chart does not have percentages listed even though it is a pie chart:
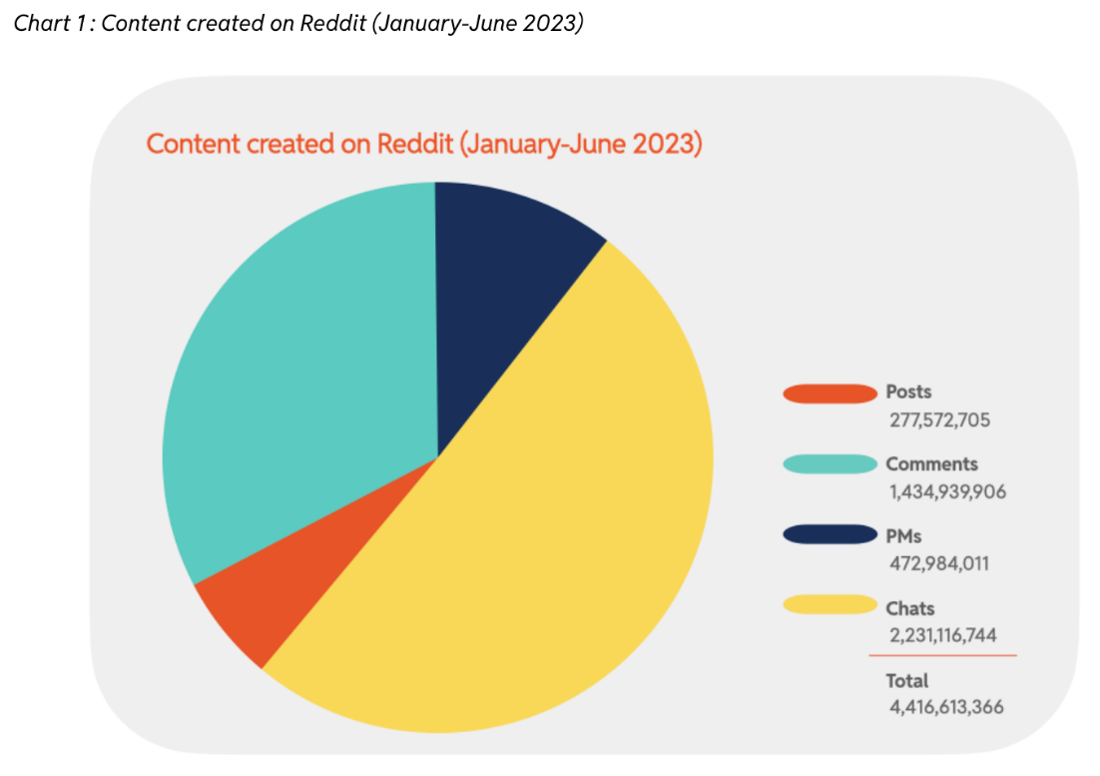
Screenshot, October 6, 2023.
Reddit has begun charging a fee for expanded access to its developer API, but a rate-limited API is still accessible by non-commercial researchers and academics. This tool could be helpful in verifying some, but not all, of the information in the reports—especially given that the bulk of content moderation on Reddit is done by volunteer moderators.
TWITCH
What’s included?
Total actions as an average for all channels, as a share of thousands of hours watched, and for specific types of violation; types of action; types of content actioned; manual vs. automated flagging and for specific types of violation; turnaround time
What’s missing?
VVR (may be difficult to calculate given the platform); most frequently targeted groups; geographic and language distribution
Consistent:
Graphs and charts include data from past reports; no easily accessible archive
Regular:
Publishes biannual reports since at least 2021 H1, and one annual report before then. Most recent report is for January – June 2023
Ease:
Accessible within four clicks for the web version, and seven clicks for the mobile version
Verifiable:
Limited to zero
Twitch began publishing transparency reports relatively recently, in 2020. The discovery process for the reports is not very intuitive, especially on mobile, and the word “transparency” does not appear until the titles of the reports themselves. While most reports include links at the end to previous reports, the most recent one for 2023 H1 does not. The archive of past reports itself is exceedingly difficult to find; we were only able to locate it by following a link embedded in an article for Wired.
Twitch’s approach to content moderation is different from the other platforms we evaluated. Since it is a live streaming service and not every stream is subsequently uploaded to a channel operator’s account, Twitch describes much of the content channels produce as “ephemeral.” This ephemerality makes it difficult to detect and adjudicate violations before they, in effect, disappear. Twitch is similar to Reddit in that channels and their moderators monitor content; on Twitch, they share responsibility with Twitch’s sitewide safety measures for enforcing rules violations that occur in text chats during live streams.
Given the specificities of the platform, Twitch’s reports focus primarily on enforcement actions taken by channels and moderators against viewers. Regarding violations by channels themselves, Twitch includes data about the total volume of user reports broken down by policy area and calculates them as a percentage of “thousand hours watched,” i.e., how many user reports were submitted on average for every thousand hours of a live stream. The data available via Twitch's API is limited to recordings made public by their creators (chat and streaming video are not available), meaning that none of its claims can be verified by independent researchers.
Recommendations
Consumer protection laws that mandate transparency reporting in other industries6 help the general public make informed decisions about the products they use, and the possible risks involved. With social media, the product is the service they provide to users (and the data they can sell about those users to advertisers).7 Mandating accessible and consistent transparency reporting lets legislators make informed decisions and develop better policy.
We recommend platform companies take the following steps:
Make links to transparency reports or centers accessible either in one click from the landing page or from a relevant policy page. Transparency reports are only transparent if they can be found. We do not expect that the majority of social media users will read these reports, but more might if they were aware of their existence. Moreover, making transparency reports more prominent sends a strong signal about a platform company’s commitment to trust and safety. At a minimum, transparency reports should be located in the same place that other policy documents, similar to the terms of service. Platforms should also include a link directly to their transparency centers or reports somewhere on the landing page, as TikTok already does.
- Include contextual data about the impact of violative content. AB 587 will require social media companies to disclose: total flagged content; total actions; total removals, demonetizations, or de-prioritizations; violative view rate; total shares of violative content; and total appeals and reversals, disaggregated by type of action. All the companies we evaluated disclose some of these data already, but none report the full list. We expect complying with AB 587 will improve transparency reporting across the board. We will reassess these companies’ transparency reporting later in 2024 to determine the law’s impact.
- Push for greater federal efforts to improve transparency. As noted AB 587, is landmark legislation at the State level that is driving positive conversation toward greater social media transparency. We urge federal legislators and other state lawmakers to follow this example and enact similar policies. Furthermore, we support and urge passage of current legislative efforts that aim to address important issues highlighted throughout this report, including: H.R.6463 - STOP HATE Act, which aims to require social media companies to publicly post their policies on how they address content generated by Foreign Terrorist Organizations (FTOs) or Specially Designated Global Terrorists (SDGTs) and S. 1876 - Platform Accountability and Transparency Act, which would require social media companies to share more data with the public and researchers.
Give greater access to data for researchers and third-party auditors. As CTS has already argued, academic and civil society researchers can be partners to tech companies in identifying gaps in policy enforcement and making online social spaces safer. Independent auditing is valuable for building trust with the public and holding platforms accountable for addressing harms. That work is only possible when researchers have access to platforms’ data—typically via open APIs—in a responsible way that protects user privacy. Yet recently most social media platforms have been moving in the opposite direction by restricting access to APIs.
Endnotes
- ADL supported the passage of AB 587, viewing it as an effective policy intervention for holding tech companies more accountable and addressing online hate and harassment.
- Note: To simulate the process of finding a report for an ordinary user, we began the discovery process from the login page of each platform on both web and mobile versions. In some cases, the pathway is shorter if the user is not logged in, and in all cases, reports were more easily discoverable by typing “[name of platform] transparency report” into a search engine.
- All date ranges referenced in this scorecard refer to the time periods analyzed in the reports, not when the reports were published.
- Meta paused new applications to CrowdTangle in January 2022.
- TikTok's mobile app has been downloaded over 3.5 billion times as of 2022, https://techcrunch.com/2022/04/26/tiktok-was-the-top-app-by-worldwide-downloads-in-q1-2022/; web traffic site SemRush reported that 85.3% of visitors accessed the site from a mobile device compared to 14.7% from a desktop https://www.semrush.com/website/tiktok.com/overview/.
- Like the INFORM Act, which creates heightened transparency requirements around third-party sellers for e-commerce platforms.
- User data is certainly another product, but when considering the risk of hate and harassment the social experience is most relevant.