Related Article
Join The National Jewish Employee Resource Group (ERG) Network
Join Us at Never Is Now
ADL’s signature event and the world’s largest summit on antisemitism and hate.
Related Resources
By Dr. Bryan Tomlin, Professor of Economics and Chair of the Department of Economics in the Martin V. Smith School of Business and Economics at California State University Channel Islands.
Independently conducted report, sponsored by ADL.
Abstract
A pre-registered, large sample, field experiment was conducted in an effort to obtain the data necessary to objectively answer the question: do Americans who signal Jewish or Israeli backgrounds experience discrimination in the U.S. labor market? 3,000 inquiries were sent to job postings across the United States using identical email text and identical resumés that differed only in (a) the name of the applicant – selected to “sound” Jewish, Israeli, or Western European – and (b) resumé signals of likely Jewish, Israeli, or Western European background. The results confirm the presence of anti-Semitic behavior in this market. Relative to the control (European American), the “Jewish Treatment” needed to send 24.2% more inquiries to receive the same number of responses; the “Israeli Treatment” needed to send 39.0% more. All differences are statistically significant across model specifications.
1. Introduction
According to a report issued by The Anti-Defamation League (ADL), 3,264 anti-Semitic incidences took place within the first three months of 2024, spread across physical assaults (56), vandalism (554), verbal/written harassment (1,347), and rallies featuring ani-Semitic rhetoric (1,307).[1] The Federal Bureau of Investigation’s 2022 Hate Crime Statistics Report showed that of 2,042 crimes based on religion, 54.9% (1,122) were “driven by anti-Jewish bias.”[2] Such religious based hate crimes are, of course, illegal, but so too are more subtle forms of anti-Semitism that may be similarly harmful to protected individuals. Specifically, Federal Labor Law prohibits discrimination against a person in hiring decisions based upon their race or national origin.[3] Unlike violent crime, such adverse treatment based on one’s religion is exceedingly difficult, if not impossible, for any one individual to prove as one has only limited interactions on which to base their conclusions. Being unaware of the skills or qualifications of other applicants, an individual applicant cannot independently determine if they are missing out on a job opportunity because of their religion, or simply because they are less qualified than the competition.
To this end, a pre-registered,[4] large sample, field experiment was conducted in an effort to obtain the data necessary to objectively answer the question: do Americans who signal Jewish or Israeli backgrounds experience discrimination in the U.S. labor market? 3,000 inquiries were sent to job postings across the United States using identical email text and identical resumés that differed only in (a) the name of the applicant – selected to “sound” Jewish, Israeli, or Western European – and (b) resumé signals of likely Jewish, Israeli, or Western European background.[5] The results conform with the general pattern of anti-Semitic behavior observed in the above referenced ADL and FBI reports: relative to the control (European American), the “Jewish Treatment” needed to send 24.2% more inquiries to receive the same number of responses; the “Israeli Treatment” needed to send 39.0% more. All differences are statistically significant across model specifications.[6]
Section II of this report details the experimental methodology, Section III examines the robustness of the data collection, Section IV analyzes the data, and Section V concludes.
II. Experimental Methodology
The methodology employed by this paper follows a between employer approach similar to that utilized by other correspondence based field experiments in the labor market, and is described in detail below.[7]
1. Treatments and sample size
3,000 email inquiries were sent to job postings across the United States between May 2024 and October 2024. All inquiries were sent from applicants whose names were chosen to be “female sounding,” specifically: Kristen Miller (Western European – “control”), Rebecca Cohen ( “Jewish Treatment”), and Lia Avraham ( “Israeli Treatment”). Each posting was sent a single inquiry from a single applicant which was randomly assigned. This random assignment resulted in observation counts of 1,036, 1,002, and 962 for the control, Jewish, and Israeli Treatments respectively.
2. Job postings selection
Job postings were sourced from Craigslist.org because it is one of the few remaining online job-boards where person-to-person email is the primary mode of interaction as opposed to an online application process, or an AI driven resumé screening.[8] All postings to which inquiries were sent were in the field of administrative assistance. This field was chosen because it offers a large sample, is ubiquitously in demand across geographic regions, and is needed across a variety of industries. It is also a position that is often “forward facing” (likely to involve direct client interaction) and may therefore be sensitive to both the employer’s prejudice and the perceived prejudice of the customers. Only listings for which all applicants were qualified were selected. For example, if a listing required fluency in Spanish, that would not be selected because none of the applicants listed Spanish fluency as a resumé item. Listings were carefully screened to ensure they were legitimate (not “scams”), but 8 such scams did slip through the cracks (and were revealed via the scammer’s response to the applicant’s inquiry). These observations were dropped from the analysis.
3. Inquiry correspondence
The inquiry email text used for all three treatments is produced in Figure 1 below. These inquiries differed only by the name of the applicant and the attached resumé.

4. Resumés and signals of treatment
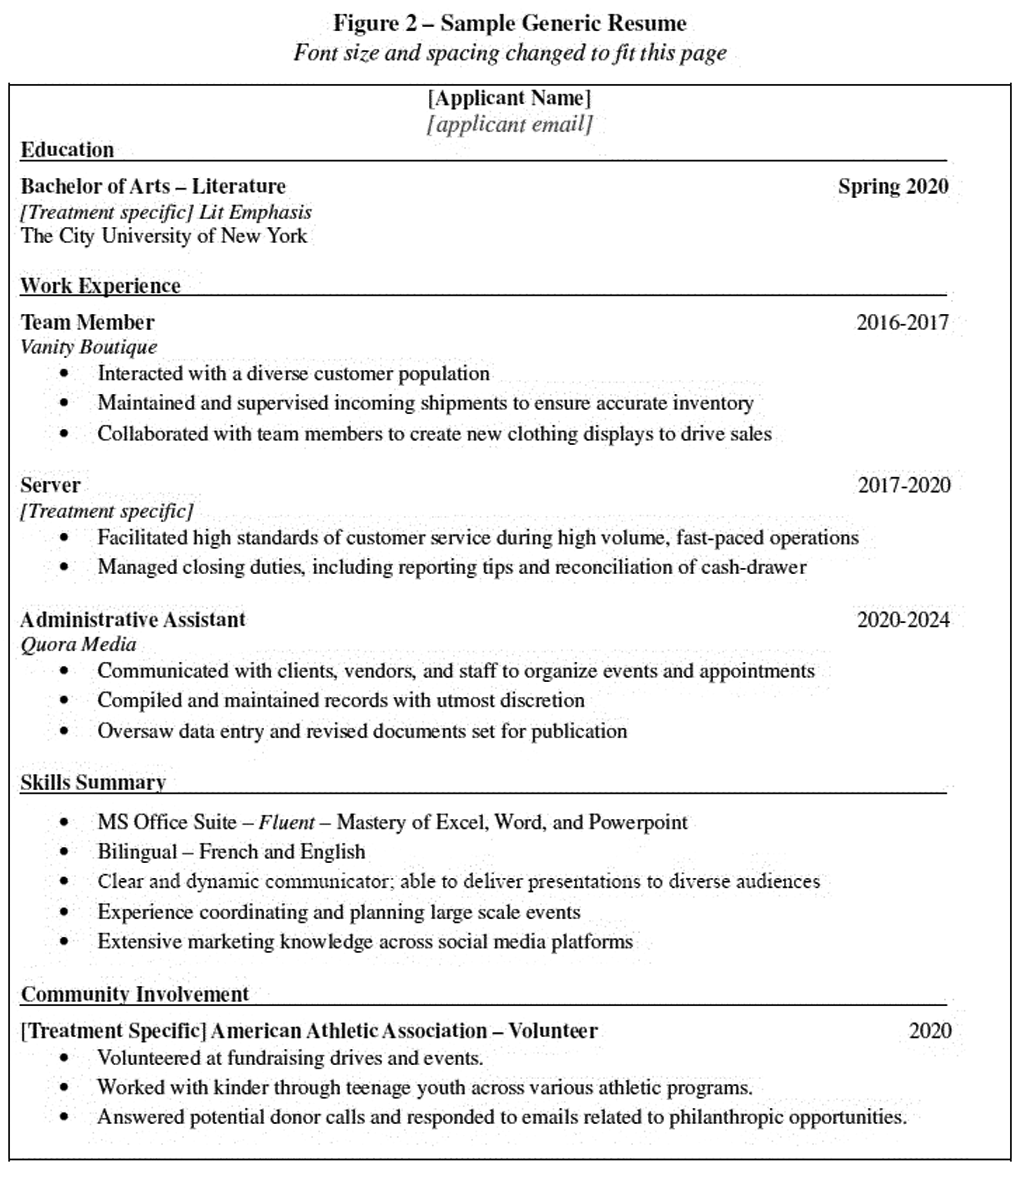
All applicants had identical resumés that were tailored for the city in which they were applying by changing the name of the institution from which they received their degree to the name of a nearby public university of solid academic reputation.[10] Figure 2 below provides a sample generic resumé.

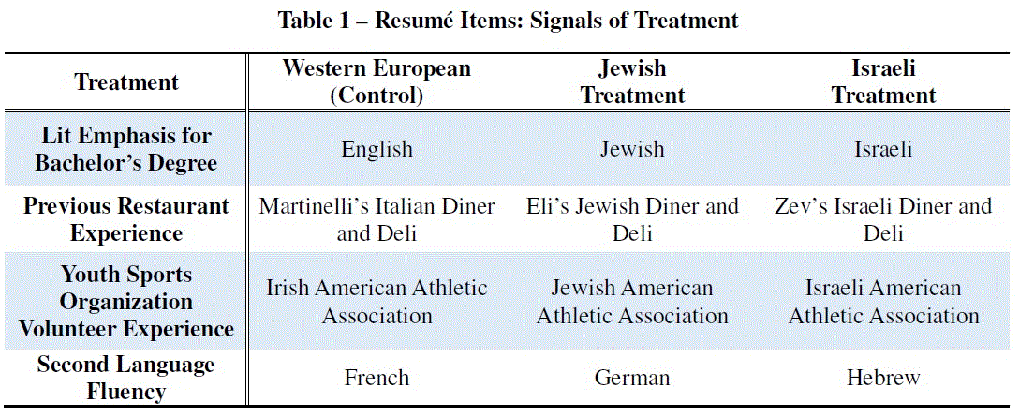
In addition to the applicant’s name and email address, the resumés included four signals of the treatment: (1) The emphasis of their literature degree, (2) The name of the restaurant at which they had previously worked, (3) The name of the youth sports organization for which they volunteered, and (4) The second language in which they were fluent. Table 1 describes the specific signals for each treatment.

5. Coding Responses
Responses from employers were coded by assigning binary answers for each of the following questions: (i) Did the employer encourage future contact? (ii) Did the employer seem interested? (iii) Did the employer state that the position was no longer available? (iv) Did the employer say anything discouraging? (v) Did the employer suggest another position? The analysis below is based on a definition of “positive response” where-in nothing negative or discouraging was stated. Specifically, for the sake of the analysis below, a response is considered to be positive if both (iii) and (iv) were answered in the negative. The results in terms of the size and statistical significance of differential treatment between groups are robust across various definitions of “positive response.”
6. Replying to responses
As is typical with studies of this nature, to ensure that employers would not slow or cease their employee-search due to the study, upon receiving a response (within 24 hours) – positive or negative – the applicant would reply with a short email thanking the employer for their response and letting them know that they had found employment elsewhere.
III. Robustness Checks
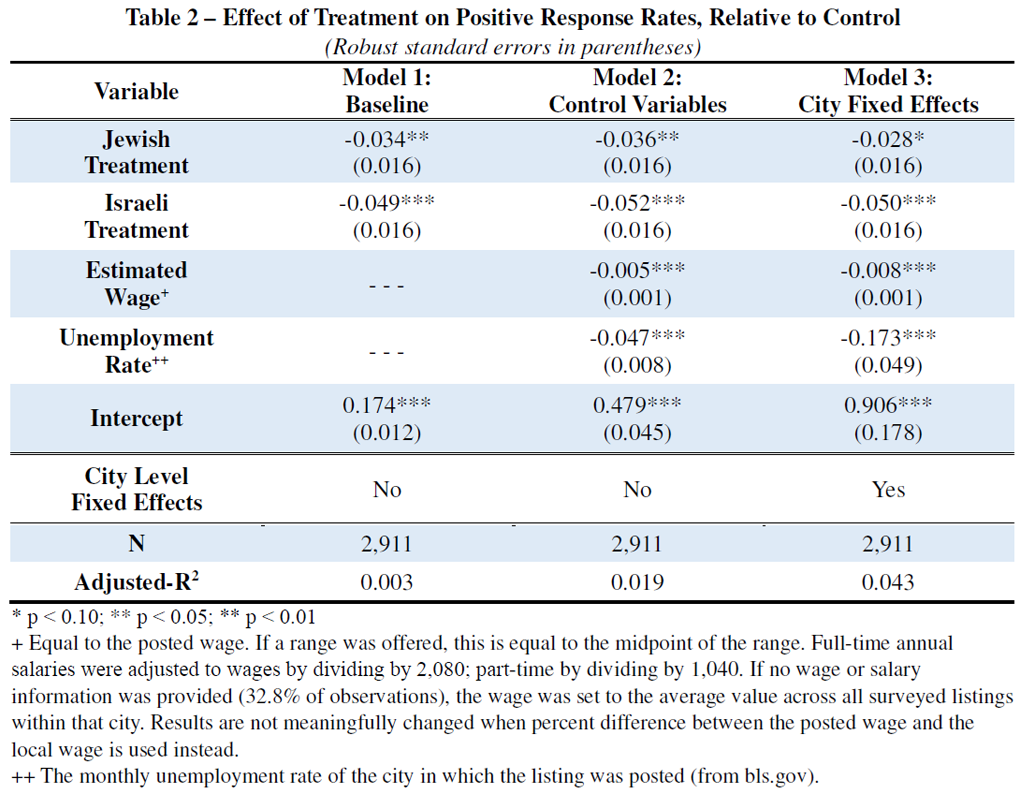
Treatments were randomly assigned across inquiries, and the analysis discussed in Section IV controls for observable differences across inquiries including the posted wage, the city in which the job was posted, and the local unemployment level in the month the inquiry was sent. As shown in Table 1: Models 2 and 3 (Section IV), the estimated effect on positive response rates of the listing’s posted wage and regional unemployment rates were both negative. This suggests that employers, on average, behaved as expected: being more selective when offering a better wage and/or when unemployment rates were higher.
Because wage and local unemployment are predictive of positive response rates, a “reverse regression” was performed (multinomial logistic) to ensure that treatment was not predictive of these listing characteristics. This test showed that neither wage nor regional unemployment were predictive of treatment, though some treatments were disproportionately represented in cities for which there were few observations. These cities (with sample sizes less than 20) were dropped from the analysis. After removing these cities and the “scam” listings, the ultimate sample size for the analysis was N = 2,911.
While it is impossible to know the extent to which the signals of treatment were perceived by employers, qualitative evidence from employer responses suggests that – when perceived – the signals were clear. For example, several responses to inquiries from the Israeli Treatment (or responses to responses) were written in Hebrew (e.g. “Behazlacha!!" in response to the response informing the employer that the applicant had found another job), or referenced the applicant’s heritage in some way. Neither the control treatment nor the Jewish American treatment received responses in their second languages (French and German, respectively), nor did they receive any responses discussing their heritage.
IV. Results
Because inquiry texts were identical and treatments were randomly assigned, differences in response rates can be attributed to the remaining differences in the applications which were controlled to be specifically the Western European, Jewish, or Israeli Treatment signals. Table 2 presents the estimated differences in response rates as determined by a baseline OLS regression (Model 1), a regression with control variables for the posted wage and regional unemployment rate (Model 2), and a regression with both controls and city-level fixed effects (Model 3).[11]

Across specifications, we see that both the Jewish and the Israeli Treatments experienced a decrease in positive response rates relative to the control. These differences are statistically significant across all three models. For example, in the baseline model (Model 1), we see that, relative to the control, the Jewish Treatment experiences a 3.4 percentage point lower positive response rate (p = 0.038) while the Israeli Treatment receives a 4.9 percentage point lower response rate (p = 0.002). This means that, to receive the same number of positive responses as the Western European Treatment, the Jewish Treatment must send 24.2% more inquiries, and the Israeli Treatment must send 39.0% more inquiries.
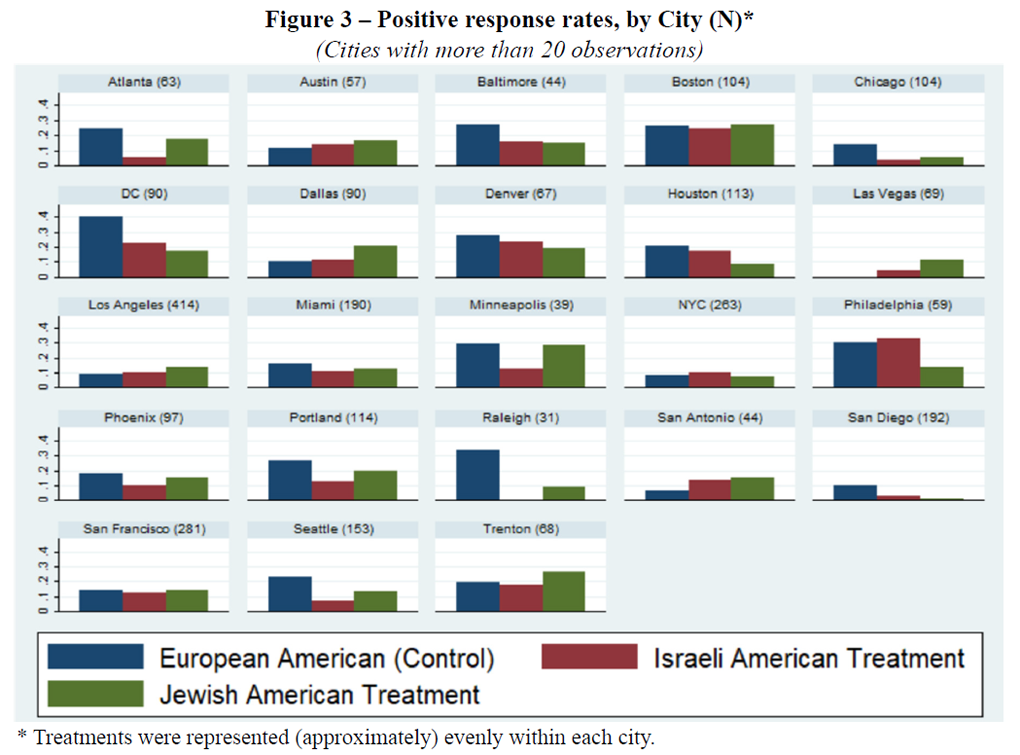
While the above results show negative differential treatment across the U.S. as a whole, a city-level examination shows that the results vary by location. Figure 3 illustrates the positive response rates for each treatment across the cities surveyed. The variance in the number of observations is due to the variance in availability of new listings across these cities.

While the Israeli Treatment fared worse on average across all markets, there were two markets in which that treatment fared better: New York City and Philadelphia. The extent to which the Israeli Treatment fared better in these markets is not statistically significant relative to either of the other treatments, even when pooling these markets together. Determining whether this result is simply noise associated with a small sample or if there is something particular about these markets is a topic worthy of future study. The only market in which the difference in response rates is statistically significant at the city level is in Seattle, where the Israeli Treatment is 16.3 percentage points less likely to receive a positive response relative to the control (23.1% vs 6.8%), and this difference is statistically significant (p = 0.014) using the Model 1 specification as well as the Model 2 specification (p = 0.018). Similar to New York City and Philadelphia, understanding why this pattern appears to be so strong in Seattle relative to other markets is a topic worthy of further investigation.
V. Discussion
The results of this analysis suggest that anti-Semitism is not limited to the readily identifiable verbal/physical space as identified by the ADL and the FBI, but also exists within the labor market, as well. However, because this study focused on the market for administrators, the extent to which these results can be applied to other markets is not known, and it would be helpful if future research were to test for anti-Semitism in other industries as well. Moreover, given the results of this study, further investigation of potential adverse treatment of these protected groups in other markets (non-labor) is warranted as well.
VI. Endnotes
[3] The U.S. Equal Employment Opportunity Commission explains: “It is illegal for an employer to discriminate against a job applicant because of his or her race, color, religion, sex (including gender identity, sexual orientation, and pregnancy), national origin, age (40 or older), disability, or genetic information.” And “An employer may not base hiring decisions on stereotypes and assumptions about [any of the above].” [eeoc.gov/prohibited-employment-policiespractices accessed 10/16/2024]
[4] RCT ID: AEARCTR-0013558; Initial Registration Date: 5/3/2024; First Published: 5/13/2024
[Tomlin, Bryan. 2024. "Labor market treatment of Jewish and Israeli Americans." AEA RCT Registry. May 13. https://doi.org/10.1257/rct.13558-1.0]
In the field of economics (and others), experiments are pre-registered for a variety of reasons. These include the ability to ensure that the experimenters did not alter their research design (possibly in pursuit of a particular result), and to allow for a transparent view of the greater research landscape that helps avoid issues such as publication bias (i.e. experiments being conducted, but results only being shared when they are “interesting,” statistically significant, and/or in service of a desired narrative).
[5] The signals themselves were designed to be similar; see Section II for details.
[6] These ratios are based on the output from Table 1: Model 1 (see Section IV for specifics).
[7] See: Lippens, L., Vermeiren, S., and Baert, S. 2023. “The State of Hiring Discrimination: A meta-analysis of (almost) all recent correspondence experiments,” European Economic Review, Vol. 151
And: David Neumark. 2018. “Experimental Research on Labor Market Discrimination,” Journal of Economic Literature, Vol. 56, No. 3, pp. 799-866.
[8] Online applications are heterogeneous, and often request answers to specific questions related to that position. This makes sending identical inquiries extremely difficult, thereby introducing noise into what is supposed to be a controlled experiment. AI screening tools may have their own biases for/against certain groups depending upon the data on which they were trained, and while this would be interesting to study, it is not the purpose of this study.
[9] The subject line was always: “Re - Your Craigslist Job Posting (listing title: [Title of employer’s Craigslist post])”
For example: “Re - Your Craigslist Job Posting (listing title: Administrative Assistant)”
The email addresses from which inquiries were sent were of the form: [First].[Last][###]@outlook.com where [First] is the applicant’s first name, [Last] is the last name, and [###] is a random 3 digit number.
[10] For example, applicants responding to inquiries posted in Los Angeles had a degree from CSU Northridge, not from UCLA.
[11] The parameters of these three models were also estimated using logistic regression. The results are similar in terms of size and statistical significance but are not here presented for ease of exposition and discussion.


