By: Kiki Sorensen, Flickr, CC: https://creativecommons.org/licenses/by/2.0/
We know that social media platforms play a large role in spreading hate speech, racism, and misinformation. In Facebook’s case, blockbuster disclosures by whistleblower Frances Haugen, a former product manager on the company’s now-disbanded civic integrity team, revealed that the company buried internal research showing it was aware of the ways the platform creates societal harm.
Transparency reports are supposed to track platforms’ enforcement of their content moderation rules. Ideally, such reporting forces platforms to be explicit about their policies on hate, harassment, and misinformation, and apply their rules consistently.
Instead, platforms’ transparency reports have failed to provide meaningful information about the prevalence and impact of hateful content. These reports are confusing, uninformative, and evasive. Platform transparency reports end up serving as a deflection away from the fact that we have very little insight into how platforms manage the ecosystem of hate online—and they have little to no legal or financial incentives to give us that access.
Compared to tech companies’ financial reports, transparency reports are inconsistent from report to report, share only cherry-picked data, and are based on guidelines set by the companies themselves, giving them wide latitude over what counts as hate or harassment.
ADL analyzed Facebook and Twitter’s transparency reports (and touched upon YouTube) and found four major problems, from inconsistency to misleading metrics, resulting in reports that are anything but transparent.
1. Reports Are Hard to Find
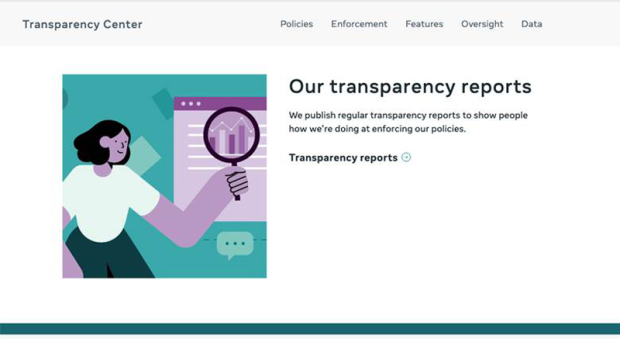
The major social media platforms publish regular reports, usually quarterly or semi-annually, but finding them can be tricky. Twitter, Facebook, and YouTube (owned by Google) have established transparency centers to consolidate all their reports, but they are not organized optimally.
Twitter’s 2021 Transparency Center
Trying to find a transparency report on these platforms, we found, is a labyrinthine exercise. ADL researchers clicked through eight different pages, starting from the home page, to find Twitter's latest Rules Enforcement transparency report. It is telling that readers must expend a lot of energy searching for information that should be readily accessible.
Twitter’s Transparency Center timeline
Twitter’s recently updated transparency center, for example, shows a timeline of its transparency efforts since co-founder Biz Stone defended its relatively hands-off policy in 2011. In his post, “The Tweets Must Flow,” he explained how Twitter then defined violative content narrowly, in his words, “to allow for freedom of expression.” The company’s first official transparency report was published in 2012 and focused on legal requests such as copyright takedowns. After 2013, Twitter produced reports with more frequency. Twitter only began releasing information about content removed for Terms of Service (TOS) violations in 2016.
Broken link to Twitter’s 2017 transparency report
In 2017, Twitter rebranded these reports as “Rules Enforcement,” but the link to that 2017 report is broken (see above), a common issue in trying to track transparency reports over time.
Facebook’s section on transparency reports within its Transparency Center
Facebook similarly launched a new “Transparency Center” in May 2021, but when we clicked the link to “transparency reports,” it took us to a newsroom post about the report. (In good news, the latest report is now listed under “Transparency Reports” and is easier to find). A link in that newsroom post directed us to the current report from August 2021 which Facebook says is its tenth, although the prior nine reports are not listed (they can be found with enough digging). There’s no PDF to download (although the data can be downloaded as a spreadsheet), making it difficult to track Facebook’s reported data over time.
Facebook’s latest Community Standards Enforcement report
Searching via Google for the report didn’t solve the problem of finding past reports either—older links to Facebook’s transparency reports redirect to the current Transparency Center. Further adding to our confusion, Facebook also publishes, or used to publish, a biannual Transparency Report, separate from the Community Standards Enforcement report. The link from the newsroom release about the biannual Transparency Report just sent us back to the new Transparency Center. In the end, we couldn’t find a separate Transparency Report (perhaps it’s been replaced by the new reports—it wasn’t clear).
Close-up of Twitter’s timeline feature, showing the August 2020 launch of its Transparency Center
Twitter’s timeline feature (the way to see past transparency reports) is more navigable, yet the link to the page announcing the new Transparency Center mentions a 16th Transparency Report without providing any link (unless the post itself is the report).
Our failed search for Twitter’s 16th transparency report
Despite hours of digging through Twitter and Facebook’s transparency centers, it was excessively difficult to find past reports or make sense of how past reports compare to the latest ones.
2. Content Is Inconsistent Across Reports
While platforms claim that they provide the public with troves of data in their “regular” transparency reports, we found that the categories of data were inconsistent, making it hard to compare changes year over year. Let’s look at the latest Twitter Rules Enforcement Report for July-December 2020 as an example. For the purpose of looking at the scope of online hate and harassment, we looked at content moderation and enforcement of terms of service (Facebook’s equivalent is its Community Standards Enforcement Report).
Twitter Transparency Center, Rules Enforcement report for July-Dec. 2020
Facebook and Twitter have over time expanded what their reports cover, which is an improvement in their overall transparency. In 2012, for example, Twitter only reported on takedown requests and government requests for user data; now, it reports on Rules Enforcement, Platform Manipulation, Email Security, and more. But because the content has varied from year to year, it is difficult to compare trends over time.
Twitter Transparency Center, section on Twitter Rules enforcement reports
Twitter’s latest Rules Enforcement report is listed under “Twitter Rules,” rather than Rules Enforcement or similar. This section name might confuse some readers, since it’s also the name of Twitter’s rules and policies.
The report is downloadable, but the download link generates a PDF that’s missing half the text—another barrier to saving and tracking these reports over time.
The PDF of the report we downloaded, which cuts off much of the text (no, it’s not cropped)
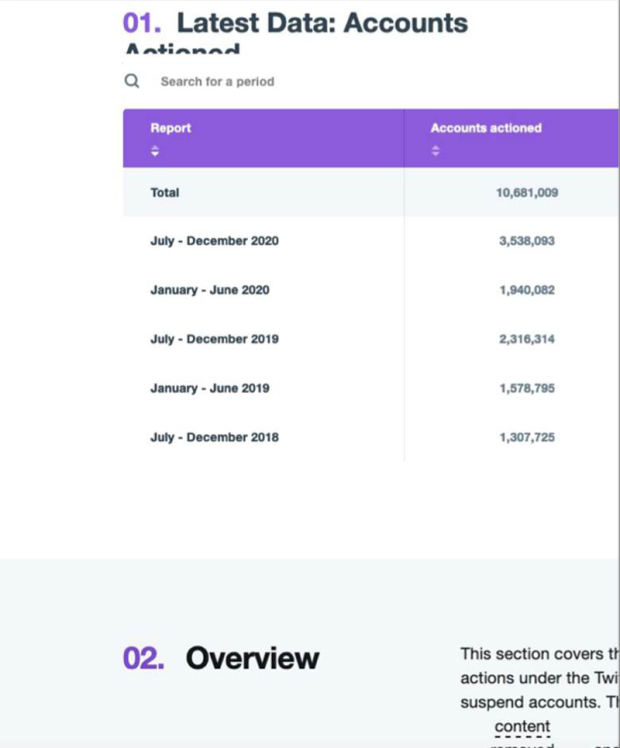
So we read the charts on the website instead. The first chart, out of three, shows a bar view of “Latest Data: Accounts Actioned.” Let’s take a closer look.
Twitter Rules Enforcement report for July-Dec. 2020, Accounts Actioned chart, bar view
The word “actioned” merits further discussion, as an industry term that’s open to interpretation. For social media platforms, “actioning content” can mean taking it down, de-ranking it, labeling it, reinstating appealed content, or engaging in other methods of content moderation.
The data appear impressive at first glance: 3.5 million accounts actioned, 1 million suspended, 4.5 million with “content removed.” What do these terms or numbers actually mean, though? How many Tweets were removed for content violations? What counts as being “actioned”? The graph shows an increase in accounts actioned over time, suggesting Twitter has improved, but offers no clarity on what the terms mean, calling that implied conclusion into question.
Twitter Rules Enforcement report for July-Dec. 2020, Accounts Actioned chart, table view
When we clicked through to “Table” view (above), we saw the numbers in more detail. Notably, the report doesn’t show the number of accounts actioned as a proportion of total Twitter accounts. Were there more Twitter accounts in 2020 than 2019 or 2018? Is the platform actually reducing the percentage of violative content or was there just more content on the platform overall? This is an example of missing fractions, where an important part of an equation is left out, such as the numerator or the denominator, in an attempt to manipulate statistics to look better. Since we don’t know the denominator (how many accounts there were in 2020 vs. 2019 or 2018), it’s impossible to know if the aggregate number improved.
3. Key Metrics Can Be Misleading
Each platform uses different metrics to evaluate its enforcement, beyond the total quantity of content removed. These metrics each measure different things, making it hard to compare how each platform is moderating content. What do these numbers actually tell us?
In July 2021, Twitter introduced a new metric, “impressions,” referring to the number of views a Tweet receives before being removed, as a Twitter blog post explains:
We continue to explore ways to share more context and details about how we enforce the Twitter Rules. As such, we are introducing a new metric–impressions–for enforcement actions where we required the removal of specific Tweets. Impressions capture the number of views a Tweet received prior to removal.
YouTube similarly has the “Violative View Rate,” introduced in April 2021.
We will release a new metric called Violative View Rate (VVR) as part of our Community Guidelines Enforcement Report. The report will have a separate section called ‘Views’ which will lay out historical and the Q4 (Oct-Dec 2020) VVR data, along with details on its methodology. Going forward, we will be updating this data quarterly. VVR helps us estimate the percentage of the views on YouTube that come from violative content.
Facebook does not have a single comparable key metric to Twitter’s impressions or YouTube’s Violative View Rate.
Facebook’s quarterly report instead includes multiple metrics: hate speech prevalence (hate speech viewed as a percentage of total content); the “proactive rate” (“the percentage of content we took action on that we found before a user reported it to us”); and “content actioned” (“how much content we took action on because it was found to violate our policies”), among others. Like YouTube’s Violative View Rate, Twitter’s “impressions” metric claims to show how many people saw a tweet that broke Twitter’s rules, rather than how long it was up before it was flagged or removed:
From July 1, 2020 through December 31, 2020, Twitter removed 3.8M Tweets that violated the Twitter Rules. Of the Tweets removed, 77% received fewer than 100 impressions, with an additional 17% receiving between 100 and 1000 impressions. Only 6% of removed Tweets had more than 1000 impressions. In total, impressions on violative Tweets accounted for less than 0.1% of all impressions for all Tweets during that time period.
Six percent of 3.8 million Tweets is 228,000 (17% is 646,000, so combined, that’s 874,000 tweets that Twitter says violated its rules and received over 100 views each). What’s the broader impact of harmful content Twitter doesn’t catch or remove? And since accounts with large follower counts are influential, even a single tweet from a popular user (say, the rapper Nicki Minaj on the Covid-19 vaccine) has the considerable power to misinform.
4. Crucial Context Is Missing
Not only are these key metrics often misleading, but there’s insufficient context needed to make sense of their significance. Twitter’s rules enforcement report provides “analysis,” identifying which rules were violated.
Twitter Rules Enforcement report for July-Dec. 2020, section 3, Analysis chart, bar view
Twitter’s top categories (based on its safety rules) separate out hateful conduct, abuse/harassment (targeted harassment and threats of harm), and sensitive media (graphic violence and adult/sexual content). Yet, as ADL research on trolling shows, the content in all of these categories can be part of networked harassment (ongoing harassment campaigns across multiple platforms) that target Jewish professionals, trans women, and women of color, among others. Other methods of harassment, such as doxing (which is listed under privacy violations), are reported separately, making the harassment numbers seem lower. It may also be unclear to those targeted how to categorize and report these kinds of violations.
More context is needed to interpret these numbers. Who is seeing the offending tweets? How many tweets are removed by proactive detection and how many are flagged by users? How long does it take to remove content or “action” an account once reported? For targets of harassment campaigns, the consequences of such abuse are considerable, and often involve multiple Tweets and accounts, which makes reporting stressful and onerous.
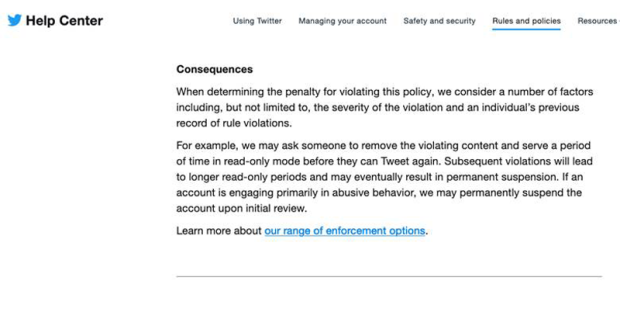
Twitter Help Center, abusive behavior, section on consequences for violating the abusive behavior rule
While Twitter highlights how many accounts it took action against (such as by muting or suspending temporarily), Twitter doesn’t mention its high bar for suspending users’ accounts. It is unclear how many times users can violate the platform’s rules before their accounts are disabled; instead of giving a clear answer, Twitter provides a link to the platform enforcement Rules.
Users who violate the “abusive behavior” rule, for example, may be asked to remove content or are temporarily blocked from tweeting (as shown above). If they are caught breaking the rules again, they’ll be blocked from posting for longer (and unspecified) periods of time. Twitter’s explanation offers few concrete details such as how many times one can violate the rules before being suspended:
For example, we may ask someone to remove the violating content and serve a period of time in read-only mode before they can Tweet again. Subsequent violations will lead to longer read-only periods and may eventually result in permanent suspension. If an account is engaging primarily in abusive behavior, we may permanently suspend the account upon initial review.
It’s unclear from the report how many actions were taken (such as removing content) versus how many accounts total were censured in some way. For accounts that violated Twitter’s rules on hateful conduct, abuse/harassment, and sensitive media, Twitter was far more likely to take temporary actions, such as muting or removing content (2,798,428 accounts) than more permanent moves like suspension or deletion (286,818 accounts, which is 10% of those actioned in some way and 7% of accounts with content removed).
In contrast, Twitter acts decisively against content violations that clearly break the law—it suspended far more accounts for child sexual exploitation (464,804) versus removing content from such accounts (9,178). Twitter clearly has the ability to take down content that violates its rules, when it’s willing to make such determinations.
Twitter Rules Enforcement report for July-Dec. 2020, safety violations
Crucial context is missing from other sections of Twitter’s rules enforcement report as well. The section on “Safety” focuses on violence, harassment, sexual content, and the like. Without context, it’s hard to know how to interpret these numbers. Twitter doesn’t report how many flags or automated detections were dismissed, only how many times it took action.
Twitter Rules Enforcement report for July-Dec. 2020, safety violations (continued)
There was a 142% increase in accounts actioned for abuse/harassment, 77% for hate, 322% increase for sensitive media (not shown), and 192% for suicide or self-harm. The latter might be the result of the many mental-health crises prompted by the pandemic, but why did general violence go up 106% while terrorism/violent extremism went down 35%? Given Twitter CEO Jack Dorsey’s admission during Congressional testimony that the platform played a role in the January 6 insurrection at the U.S. Capitol, this figure on terrorism raises questions.
Twitter Rules Enforcement report for July-Dec. 2020, privacy violations
Although Twitter reports removing most harmful content through a combination of “proactive” detection and user flagging, the Rules Enforcement report doesn’t quantify the impact of hateful or abusive content that remains. Privacy violations, as mentioned earlier, are treated as separate from abuse or hate, including doxing and non-consensual distribution of intimate imagery (sometimes called “revenge porn”), which are frequent and exceedingly damaging forms of harassment. Similarly, impersonation (not shown) is listed under “Authenticity,” yet is also a tactic harassers use against targets.
Like Twitter, Facebook’s transparency reports are unreliable at best and misleading at worst.
Facebook’s latest Community Standards Enforcement report for Q2 2021 details metrics such as prevalence, content actioned, and proactive rate, defined earlier, for each category of content that breaks its rules. Crucial categories are missing, like mis- and disinformation.
Documents uncovered by whistleblower Frances Haugen show that Facebook removes a much smaller percentage of hateful and abusive content than the company has claimed. Contrary to Facebook’s claims of how much hateful content the world’s biggest social media company removes, an internal study disclosed by Haugen showed that the company actions as little as 3-5% of hateful content and 0.6% of content invoking violence and incitement.
In Facebook’s first quarterly Community Standards Enforcement report from 2020, the company claimed that it had increased its moderation of content in Spanish, Arabic, and Indonesian and described unspecified improvements to its English moderation technology:
Our proactive detection rate for hate speech on Facebook increased 6 points from 89% to 95%. In turn, the amount of content we took action on increased from 9.6 million in Q1 to 22.5 million in Q2. This is because we expanded some of our automation technology in Spanish, Arabic and Indonesian and made improvements to our English detection technology in Q1. In Q2, improvements to our automation capabilities helped us take action on more content in English, Spanish and Burmese.
Facebook’s latest report from Q2 2021, however, doesn’t categorize content actioned by language or explain the direct impact of the increase in Spanish, Arabic, and Indonesian content moderation. This omission makes it difficult to compare quarterly results of content moderation by language, and may give a false impression of improvement. Facebook claims the prevalence of hate speech dropped by .05% in Q2 2021. Where did it drop geographically? Which language did it drop in? Did it rise in some markets? What type of hate speech? What was the scope of the technology used to categorize it? The company’s numbers don’t provide any insight into whether it’s making meaningful progress.
What Should Platforms Do?
In contrast to these reports, Facebook and other platforms provide much clearer, more consistent financial reports, as mandated by the Securities and Exchange Commission. Additionally, they provide more thorough transparency reporting for “obviously illegal content” in Germany, as required by the country’s NetzDG law.
To be worthwhile, transparency reporting must: a) be consistent from report to report in terms of numbers and categories of violations; b) provide context for terminology, exceptions to rules or changes; and c) be comprehensive. High-quality reporting means not just publishing numbers, but explaining the significance of those numbers. Readers should be able to understand how such content is flagged or detected, how much reported content stays up, whether flagged content will be removed or otherwise “actioned,” and what types of “actions” are possible.
Transparency reporting is necessary to ensure platforms actually enforce their terms of service, which Facebook and other platforms have shown again and again that they fail to do. Enforcing terms of service is a key step in providing space for discourse and social connection that’s free from hate, abuse, discrimination, harassment, and violence. Unchecked, hateful and extremist content pushes women, people of color, LGBTQ+ people, and other marginalized groups out of online spaces.
We Need Government Action
If there’s one important takeaway from our analysis, it’s that Big Tech cannot be trusted to regulate itself. It’s time for real transparency.
Government mandates and oversight are necessary so the public can understand how platforms’ practices affect society. This is why ADL supports California’s social media transparency bill, AB 587, as a necessary step in the direction of compelling tech companies to undertake more comprehensive reporting. The bill would require social media platforms to publicly disclose their policies regarding online hate/racism, disinformation, extremism, and harassment, as well as key metrics and data around the enforcement of those policies. The disclosure would be accomplished through biannual and quarterly public filings with the Attorney General to:
- Disclose corporate policies, if any, regarding:
- Hate speech and racism
- Disinformation or misinformation, including health disinformation, election disinformation, and conspiracy theories
- Extremism, including threats of violence against government entities
- Harassment
- Foreign political interference
- Disclose efforts to enforce those policies.
- Disclose any changes to policies or enforcement.
- Disclose key metrics and data regarding the categories of content above, including:
- number of pieces of content, groups, and users flagged for violation
- method of flagging (e.g., human reviewers, artificial intelligence, etc.)
- number of actions
- type of content action and flagged
We cannot leave it up to social media platforms to give us a clear understanding of the scope of online hate and who is affected. As Frances Haugen demonstrated, platforms like Facebook will do everything they can to mislead the public. Such malfeasance cannot continue. Our democracy is at stake.
